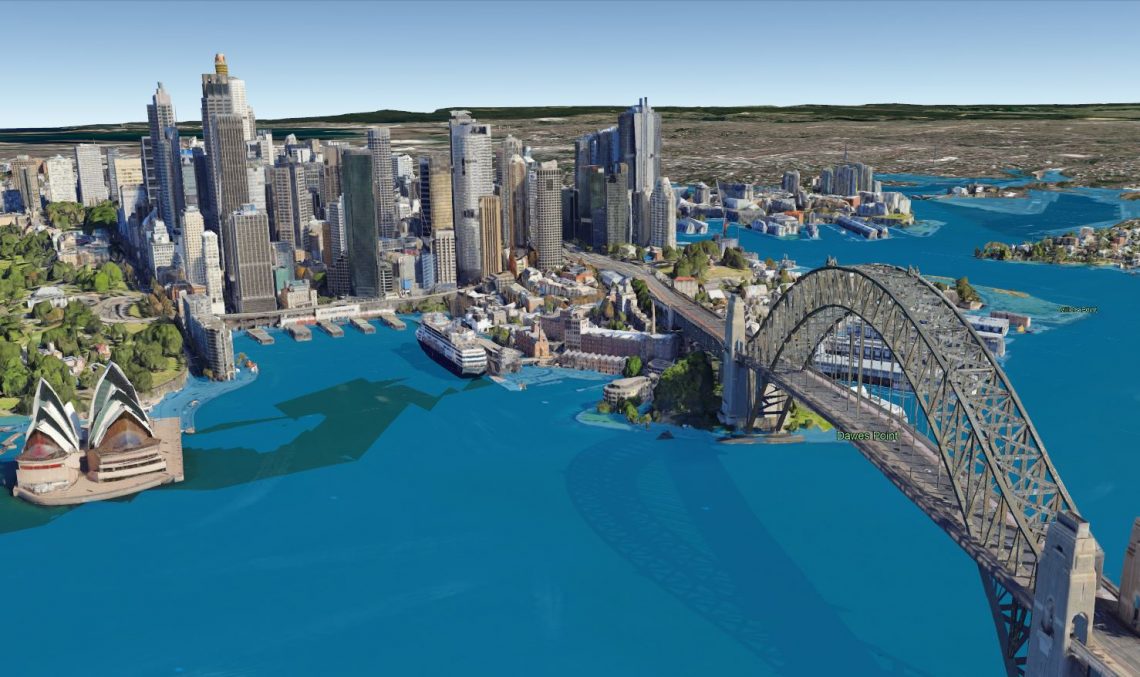
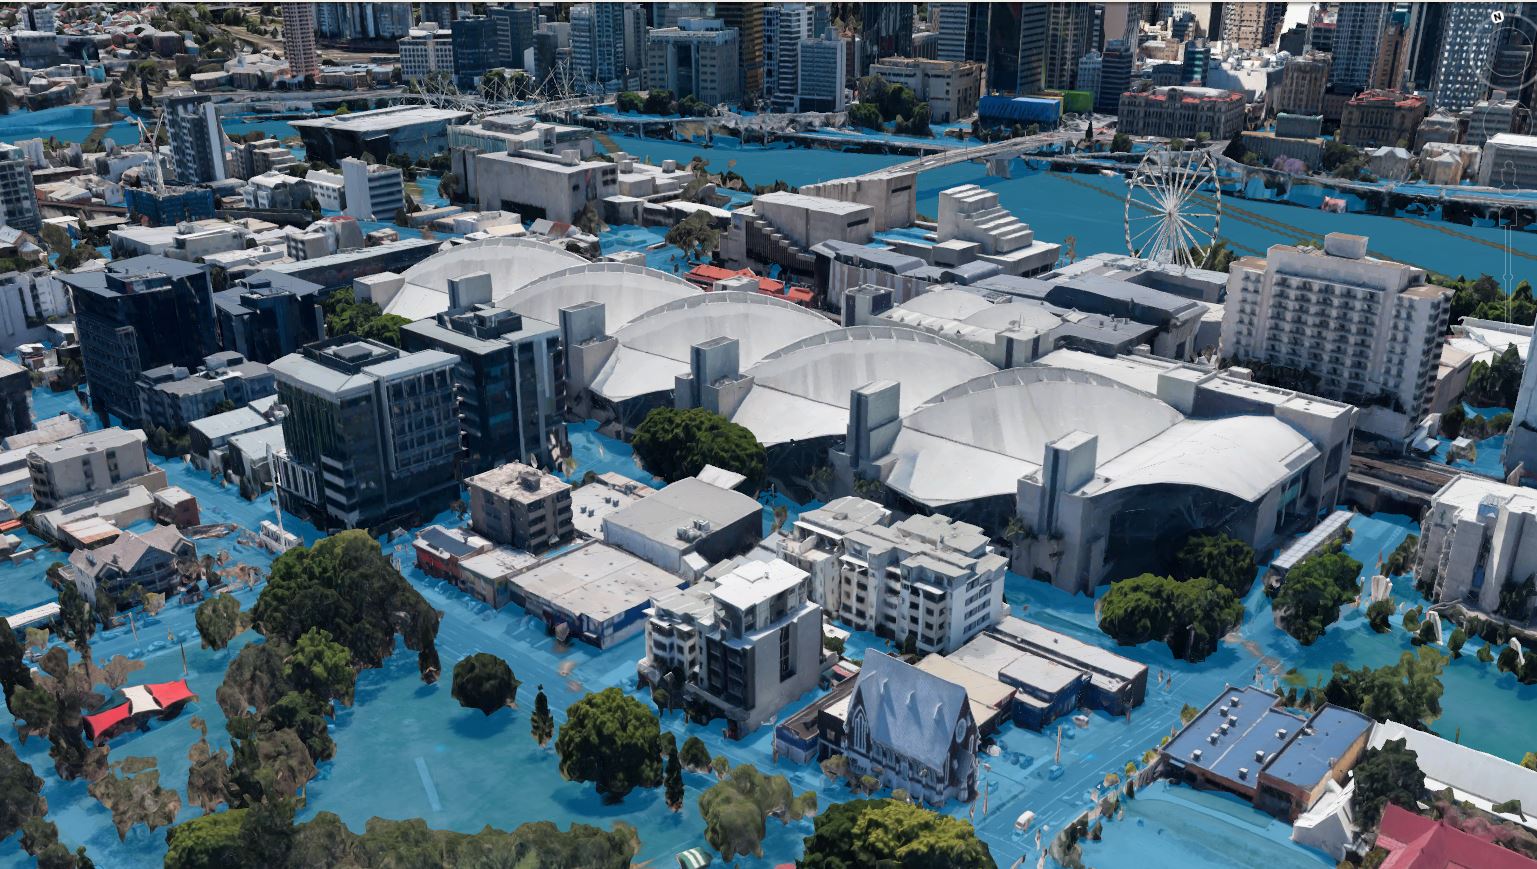
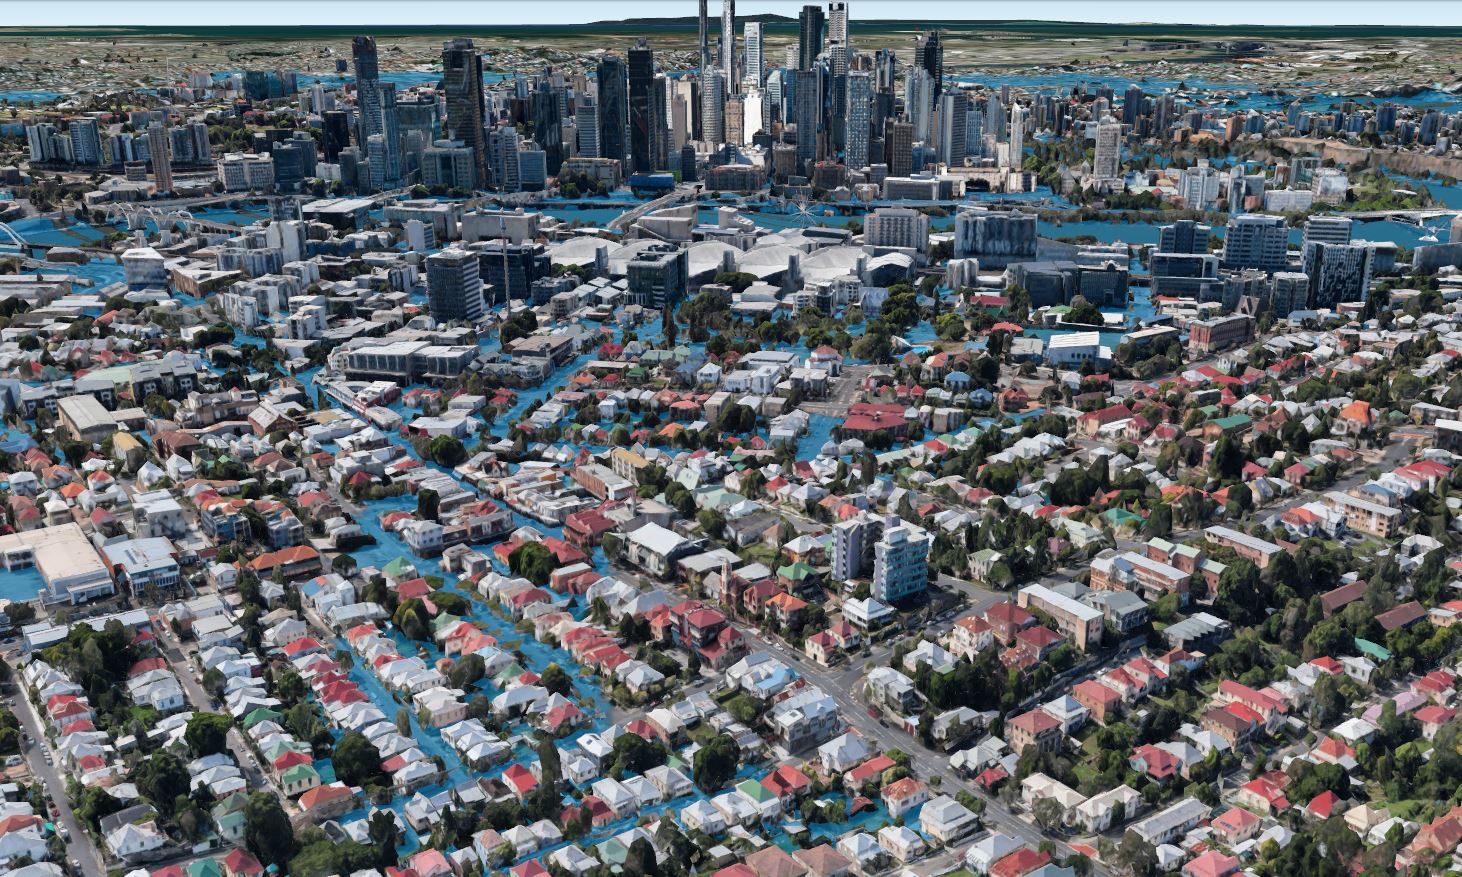
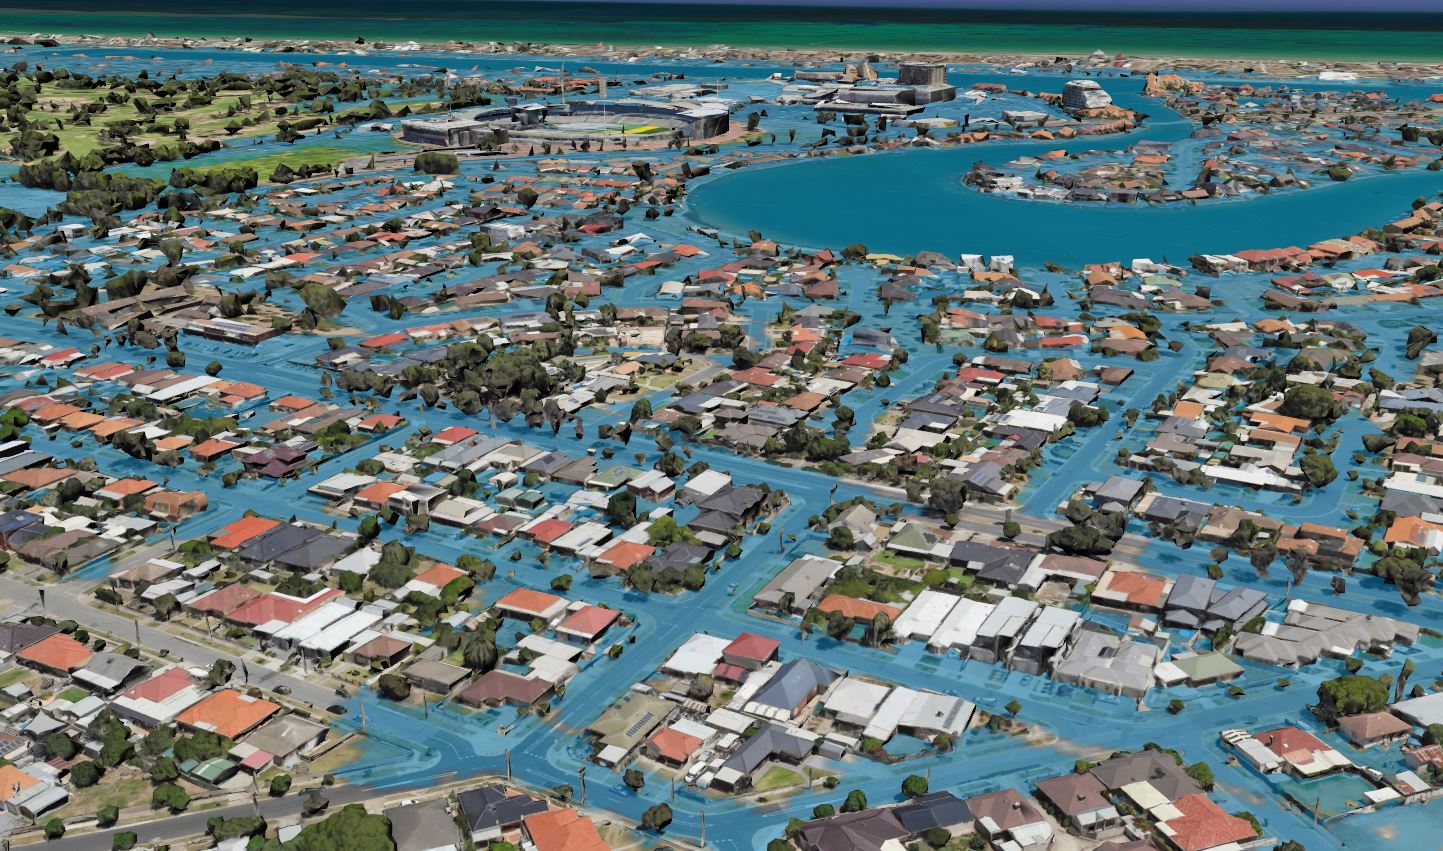
JBP is a custodian of the Australian Flood Map – an industry-led project to continuously update a suite of flood maps throughout Australia. Australia was a pioneer country to be mapped as part of the JBA Group World Flood Map. Australian maps now include pluvial and fluvial mapping, for six return periods (20, 50, 100, 200, 500 and 1,500-year), at a 5m (city and major regional centres) and 30m (all remaining areas) resolution. The flood maps have been subject to regular updates in 2015, 2016, 2019 and 2021, which have included:
• BoM 2016 IFDs and Australian Rainfall and Runoff (ARR) approaches used for all new 5m update regions.
• Improved mapping in areas where high quality LiDAR data are now available. Our maps now have two resolutions: 5m for major cities, northern QLD and northern New South Wales, with 30m mapping throughout the remainder of the country
Development and improvements
When initially developed in 2012, national elevation datasets were limited, with a 30m Digital Surface Model (DSM) sourced from the NEXTMAP World30 DSM for use in Australia. Improvements were made to the mapping in 2015, using newly acquired elevation data in various states, which included a Queensland Government contour-derived Digital Terrain Model (DTM). Limitations remained, however the updated data provided an improvement on the World30 DSM and was considered the most suitable information at the time.
Hydrologic analysis has been separated for large and small catchments. For the 30m maps, large catchments have used an empirically based rainfall-runoff approach linking design rainfall to design river flood magnitude. The model is based on a global rainfall hindcast provided by the Climatic Research Unit (CRU), with the CRU TS 3.2 dataset providing gridded rainfall data at 0.5° spatial and monthly temporal resolution for the 1901-2011 period. The 110-year long monthly rainfall hindcast was extracted for analysis points within upstream catchments, and design rainfall statistics calculated for a range of return periods. An analytical calibration was undertaken to transform design rainfall to observed river discharges and a flood frequency tool created to relate catchment rainfall, climate and river regime properties to estimated design flows at each 2km river chainage.
For small catchments, the 30m maps use design rainfall estimates to represent pluvial / surface water flooding. This has used the Climate Forecast System Reanalysis (CFSR) precipitation dataset. Developed by the National Centers for Environmental Prediction (NCEP), this provides hourly rainfall totals on a 0.3o grid for the 1979-2009 period. Design rainfalls were calculated using extreme value statistical analysis on the gridded data for three storm durations; 1-hour, 3-hour and 24-hours.
The 2018/19 updates offer significant improvements to hydrology estimates and mapping. Rainfall estimates were improved by extracting a 20x20km grid of extreme rainfall depths from the revised BoM (2016) IFD website. This data had been developed from over 30 years of recorded rainfall data, using contemporary statistical analysis. New inflow hydrographs were also created for all waterways. National streamflow data was obtained from the BoM for 644 gauges with observed daily maximum data and catchment areas of >1,000km2. Data was subject to several quality reviews; with data that had obvious errors or values that had poor quality codes were removed, gauges that were flagged by checks involving their median flow (QMED) and L-moment ratios, and areas with questionable data flagged through their annual maximum (AMAX) series. A Log Pearson Type III distribution (LP3) was fit to each gauge log-transformed AMAX series, with extreme flow estimates then integrated with an upstream waterway area factor. Statistical and spatial analysis was undertaken to fit distributions across all gauge records using L-moments, and used to estimate extreme flows for every watercourse in Australia at a 2km chainage.
Hydraulic modelling has been performed in JFlow, a full 2D hydrodynamic model using Graphics Processor Unit (GPU) technology (Crossley et al, 2010 & Lamb et al, 2009). To simulate large catchment flooding, a traditional fluvial model configuration has been used. Queensland was discretised into many model sub-domains and flood hydrographs generated at flow estimation points. The volume of water that can be held within the river channel was estimated and removed from the flood hydrograph, with the hydraulic model then simulating the remaining volume of water for each return period across the floodplain by solving full shallow water equations. For small rivers and surface water, a direct-rainfall configuration was used in conjunction with design hyetographs. In towns and cities, losses due to urban drainage systems were considered by removing the 5-year rainfall total from the hyetograph
Licensing
Assess to the Australian Flood Map is through a license. Any region can be accessed, from a national, state, Council or street level.